If it's between many words and a few visual components, you and your audience will probably prefer the latter. And yet -- even in this age of tablets, multimedia, gesture and voice recognition, and high-bandwidth connections -- such pictures are a rare medium for communicating our intentions to a computer, regardless of field. Visual programming languages (true ones, not "visual basic", for example) have generally not fared well.
It's true that language processor (compiler) folks have developed most of their techniques and formalisms in the textual realm, but that's hardly an excuse or reason. I'm talking here about the computer-human interaction: If it's formal enough, establishing another internal representation as text (or other bit sequences) is not difficult. And graph grammars have been around for decades.
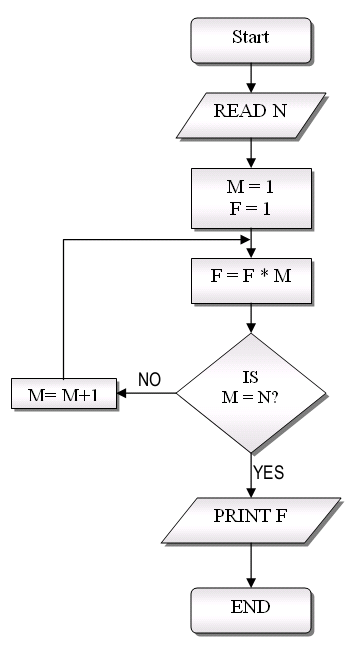
So, we were also told to (somehow) keep our flowchart with the finished program, for later reference: Virtually impossible. Since then, we have found ways to convey about as much information about the control flow in the program itself, using indentation -- so-called structured programming -- and flowcharts are now très passé. A success of software engineering!
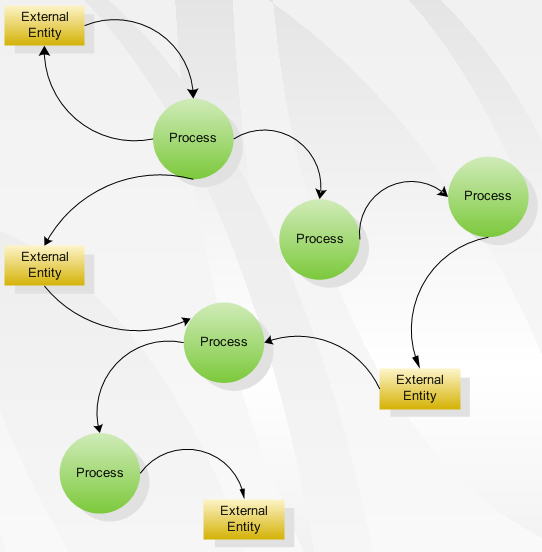
Even so, when detailing data flow (how data moves) within a computer program, we almost always use the same "spaghetti code" symbol-matching tricks, but now based on a variable name (instead of statement labels) to establish a relationship between previous definition and next use. In imperative languages, data and control flow are managed separately (with variables for one, control constructs for the other), and programming is the art of getting them to work in tandem to produce a desired result.
And when it comes to parallel processing, we traditionally add yet another set of paths for both control and data flow between processes, using yet another layer of associative matching in either message passing (tag/type and process ID) or shared memory (address or name of shared variable or lock). And the results of those communication matches are entirely dependent upon the confluence in the control and data flows of the individual processes/threads, to the point that the communication matches may (commonly) be non-deterministic.
Alright then, how about increasing the granularity of the dependences? Increase the size of the data objects flowing (technically "data" not "datums"), thereby decreasing the number and complexity of the dependences, perhaps even to the point that visual representations become feasible again, and shrinking the associative bottleneck. That does indeed solve some of the problem. But it still suggests that control flow is the result of data flow, and now there's more data to flow to lead to such control, resulting in significant overhead for control transfer, moving data around (often needlessly) just to get the right part of the program to "light up" with activity/control. Can't we manipulate the control and the data separately, but let them both operate along the same paths when convenient?
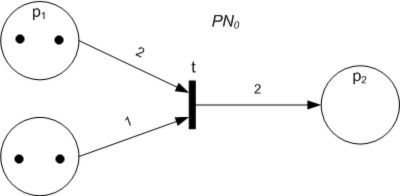
 and a bunch of finite state automata -- each lending themselves to visual representation -- or, if you like, a network of Turing Machines passing tapes around. Through the years, the concepts have evolved, as has the name -- from LGDF2, to F-Nets, to Software Cabling, and now to ScalPL (Scalable Planning Language). All of them have been based on a similar simple circles-lines-boxes visual representation. In my new book, I suggest that the principles and uses extend well beyond the computer programming field, to almost any kind of concurrent planning, but that in the parallel/concurrent programming world, it is the logical extension of structured programming.
No comments:
Post a Comment